Revenue Growth

Does Innovation Drive Revenue Growth ?
Across Thousands of Listed Companies, the Most Inventive Grew Revenue Twice as Fast as the Least Inventive
TL;DR
Across 43,704 listed companies worldwide, the companies that produced the most inventions relative to their revenue grew revenue by a median of 29.2% over the following five years, compared with 13.8% for the least inventive companies in the same industry and size bracket. That works out to roughly 5.3% a year against 2.6%. The gap opens in the first year and widens in every year after, and it holds when companies are compared only with peers of similar size.
Does patent activity show up in fundamentals?
In our first article we described patent data as an independent record of what a company is working to protect, and we promised to test whether that record connects to the numbers investors care about. Management teams talk about innovation in every earnings call, and R&D budgets keep growing, but an analyst still has to decide whether any of it will reach the income statement. The question for this article is simple: do companies that invent more grow faster?
The academic literature suggests they should. In a study published in the Quarterly Journal of Economics, Kogan, Papanikolaou, Seru and Stoffman used more than 80 years of U.S. patent records to show that companies with more valuable patents went on to grow output and productivity faster. We wanted to test whether the same holds for listed companies worldwide, using the number a fundamental analyst cares about getting right: revenue.
The most inventive companies grew revenue about twice as fast as their least inventive peers of the same size, in the same industry.

How we measured it
Our study covers listed companies worldwide with at least USD 10 million in revenue: 43,704 companies in all. At the end of every year from 2012 to 2020 we ranked the companies and tracked each one's revenue over the next five years, with the last period ending in 2025. A company can appear in up to nine of these annual rankings, in a different group each time.
The measure is inventions per revenue: the number of inventions a company published in the twelve months before the ranking date, divided by its trailing twelve-month revenue. Only information that was public on that date goes into the ranking. We divide by revenue because a raw count mostly reflects company size. Within any industry, the largest companies naturally file the most, and a ranking on counts ends up sorting by size rather than by how hard a business is investing in new technology. We wanted to measure how much a business invents for its size.
Each company is ranked only against its peers: companies in the same industry group and, in the version shown here, the same revenue band (the industry split into thirds by revenue). The rankings are then split into five equal groups, from Q1 (lowest invention intensity) to Q5 (highest). Companies that published no inventions in the prior twelve months are shown separately for comparison; they may still own older patents. We report the median company in each group, so a few extreme results cannot skew the picture.
What the data shows
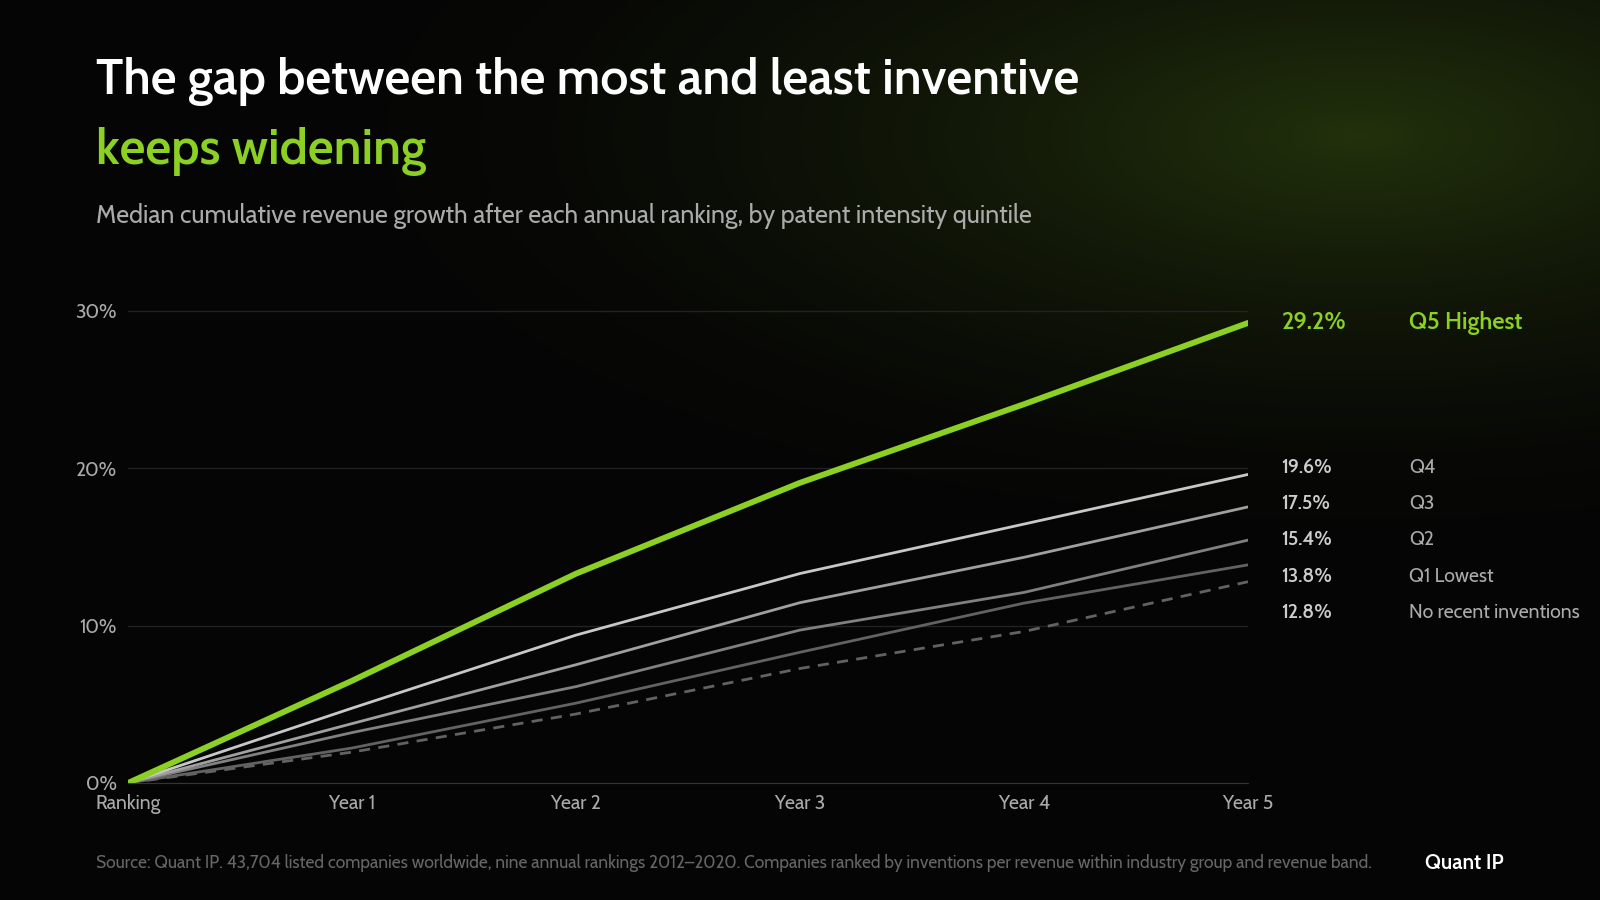
At every horizon from one year to five, each group grows faster than the one below it, and the companies with no recent inventions grow slowest of all. Researchers call this a monotonic relationship: each step up in invention intensity corresponds to a step up in growth. That is a stronger result than a gap between the top and bottom groups alone, because a consistent ordering across every group and every year is much harder to produce by chance or through a few outliers. The most invention-intensive fifth of companies grew revenue by a median of 29.2% over five years, while the least intensive fifth grew 13.8% and companies with no recent inventions grew 12.8%.
The gap also builds over time rather than fading. After one year the most intensive companies were ahead of the least intensive by 4.3 percentage points, and after five years by 15.4. A gap that keeps widening for five years is what an investor would want from a leading indicator.
Is this just a small-company effect?
Dividing by revenue puts companies of different sizes on a comparable footing, but it introduces a potential issue. A small company, or one whose sales have temporarily dropped, can rank high on inventions per revenue without being especially innovative, and small companies tend to grow faster in percentage terms anyway. If that were driving the result, the premium would disappear once companies are compared only with peers of similar size.
The premium narrows but holds. When the ranking is done within industry alone, the five-year gap between the top and bottom groups is roughly 20 percentage points; ranked within industry and revenue band, it is 15.4. More than three-quarters of the gap survives the size control, so company size accounts for less than a quarter of the result.
What it means for fundamental investors
Companies at the bottom of the ranking grew only about one percentage point more over five years than companies with no recent inventions. The dividing line is how much a company invents relative to the size of its business, measured against direct competitors of similar scale, rather than whether it has any recent inventions.
That makes patent intensity a practical innovation metric for the questions an analyst already asks. When management presents a growth story, a company that ranks near the top of its peer group has supporting evidence, while one that ranks near the bottom deserves harder questions about where the growth will come from. Either way, the next step is to check whether the company's recent inventions match the products behind the forecast. When two companies in the same industry look similar on the numbers, their relative invention intensity is one way to judge which of them is better positioned for the next three to five years, well beyond the next quarterly report.
A consistent relationship, not necessarily causal
A study of this kind shows a consistent relationship, and it does not prove that patents cause growth. Companies that invest heavily in new technology may also have better management, stronger balance sheets or more attractive end markets, and some of the premium may reflect those qualities. The results are medians, so plenty of highly inventive companies will still disappoint, and they describe revenue only; whether the same pattern holds for margins and earnings is a question for a future article. Revenue growth is also different from stock returns: our study does not show whether investors had already priced that growth in.
FAQ
Does patent activity predict revenue growth?
In Quant IP's study of 43,704 listed companies from 2012 to 2025, companies with the highest invention intensity grew revenue by a median of 29.2% over five years, compared with 13.8% for the least intensive companies in the same industry and size bracket. The five groups line up in order at every horizon from one to five years.
How long does it take for innovation to show up in revenue?
The gap between the most and least inventive companies is already 4.3 percentage points one year after the ranking date and widens every year, reaching 15.4 percentage points after five years. Our study tracks groups of companies, not how long any single invention takes to produce revenue.
Why measure inventions per revenue instead of the number of patents?
Within an industry, the companies with the most patents are usually the largest companies. Dividing a company's inventions by its revenue measures how much it invents relative to the size of its business, which makes companies of different sizes comparable.
Is the result explained by company size?
Mostly not. Comparing companies only with peers in the same industry and revenue band reduces the five-year gap between the top and bottom groups from roughly 20 to 15.4 percentage points, so more than three-quarters of the difference remains.
Do companies with no recent inventions grow more slowly?
Slightly. Companies with no inventions in the prior twelve months grew revenue by a median of 12.8% over five years, about one percentage point less than the least inventive group and well behind the most inventive group.
About us
Quant IP is an alternative data provider delivering patent data and innovation analytics built for financial markets. Its Solution for Innovation Analytics (SIA) helps fundamental and thematic investors compare companies, investigate technology exposure and assess competitive position. Systematic teams can evaluate company-level or invention-level patent data feeds for their own research.
Disclaimer
This content is for informational purposes only and does not constitute investment advice, financial analysis, or a solicitation to buy or sell any financial instrument. The information provided makes no claim to completeness or accuracy.
Schedule a demo