Patent Data Was Predictive of Excess Returns

Four Head-to-Head Case Studies Where Patent Data Was Predictive of Excess Returns
NVIDIA, Arista, RTX and Eli Lilly Performance vs Competitors
TL;DR
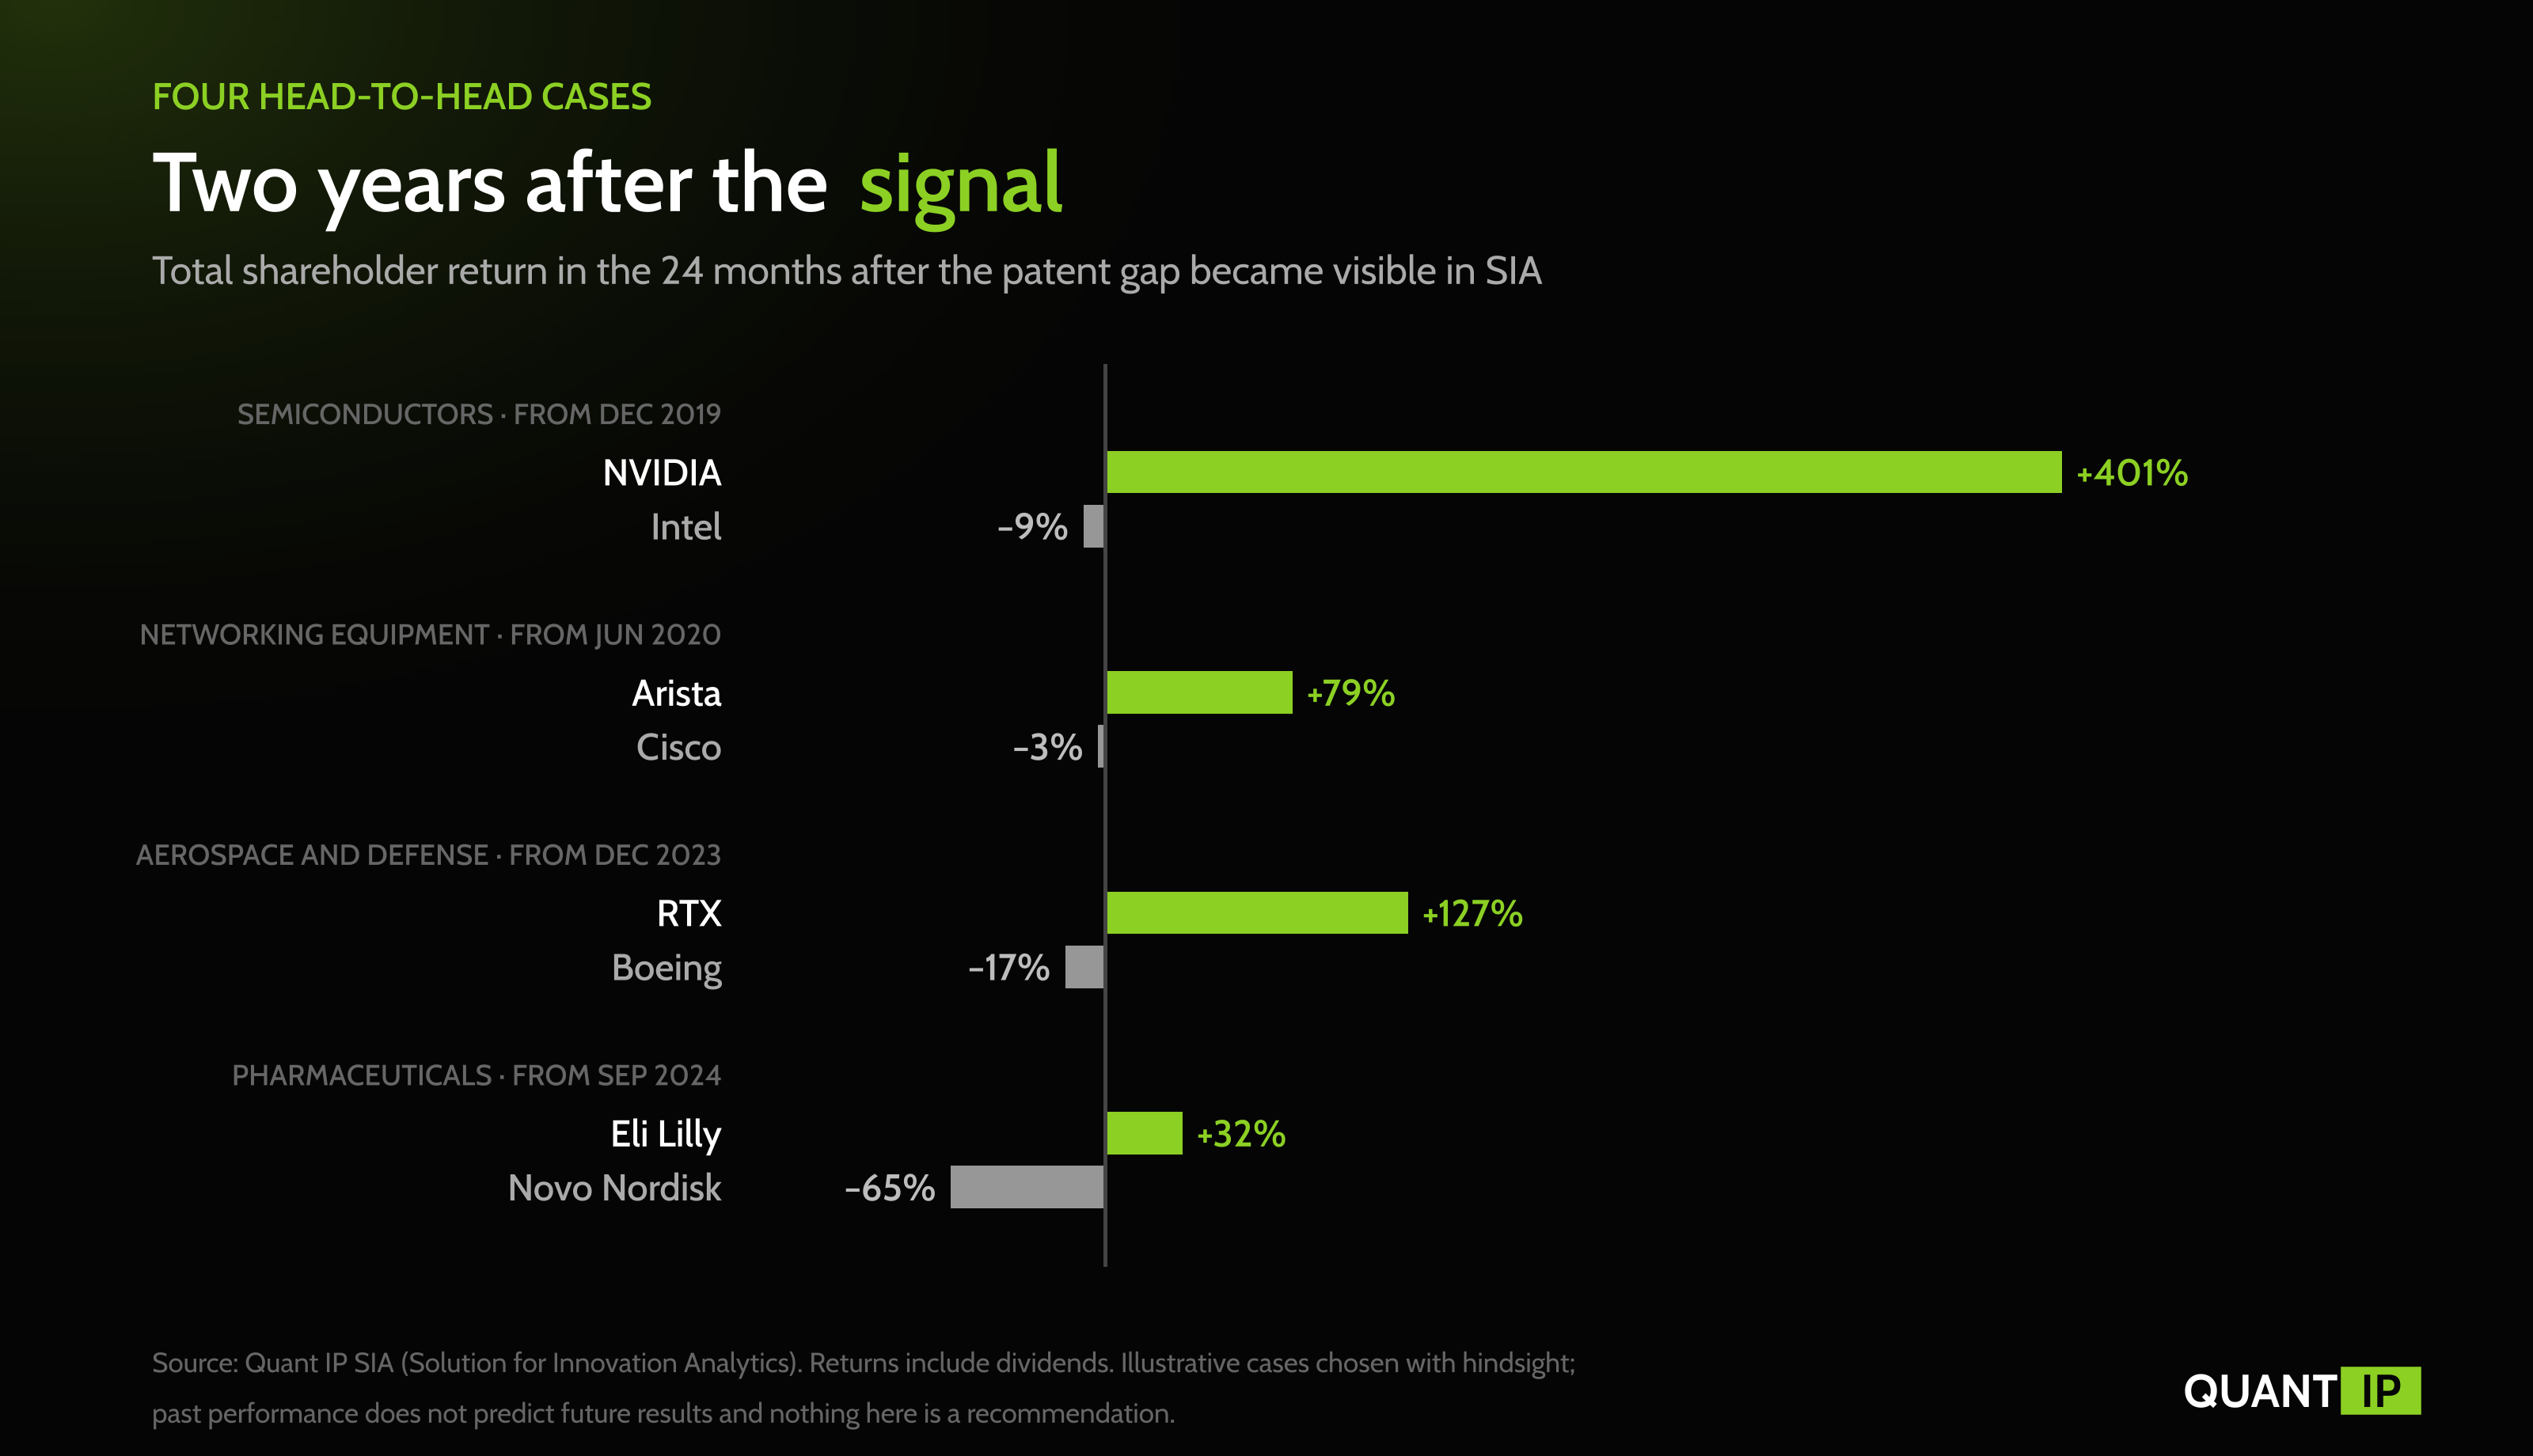
In four industries, a gap opened in the patent records of two direct competitors before it opened in their share prices. Quant IP's Solution for Innovation Analytics (SIA) showed NVIDIA's invention output more than doubling in 2019 while Intel's stalled, Arista's rising 75% in the year to June 2020 while Cisco's slipped, RTX's growing in 2023 while Boeing's fell by more than a third, and Eli Lilly's rising 47% in the year to September 2024 while Novo Nordisk's fell 19%. In each pair, the company with the stronger patent momentum delivered the higher total return over the following two years, by margins of 82 to 410 percentage points. The cases were chosen with hindsight to show how investors can use the data, and none is a recommendation.
How to read these case studies
In our first article we described patent data as an independent record of what a company is working to protect, and in the second we showed that across 43,704 listed companies the most invention-intensive grew revenue about twice as fast as their least inventive industry peers. This article looks at four pairs of direct competitors, one pair per industry, and follows each from the moment the patent record separated them to what happened to their shares over the next two years.
Each case uses the same structure and the same measures. The signal date is the quarter-end at which the gap between the two companies first showed clearly in SIA and then held. The patent figures are inventions, meaning patent families, so one invention filed in many countries counts once: the number published in the previous twelve months, the change on a year earlier, each company's rank within its SIA peer group and its count of high-quality inventions. Returns are total shareholder returns, including dividends, measured twelve and twenty-four months after the signal date.
To complete the cycle, each case ends with what $10,000 placed in each company on the signal date was worth two years later, and with the gap between the two. These are hypothetical, past results for cases selected after the fact, and they leave out trading costs and taxes. The broader evidence comes from tests that do not pick winners with hindsight: in Quant IP's sector-neutral backtest of the US universe, companies with the most high-quality inventions outperformed companies with none by 4.9% a year and did so in 16 of 25 years.
Case 1: NVIDIA vs Intel in semiconductors
Going into 2020, NVIDIA and Intel were two of the chip companies most closely tied to the growth of data center computing, and SIA showed their patent records moving in opposite directions.
The company. NVIDIA was still best known for gaming graphics cards at the end of 2019, and its data center business was smaller than its gaming segment. The investment case rested on whether its GPUs would become the standard platform for AI computing.
The competitor. Intel was the incumbent, with more than twenty times NVIDIA's annual invention output and the second-highest innovation score among roughly 3,000 listed semiconductor companies in SIA, but it was struggling to move to its next manufacturing process.
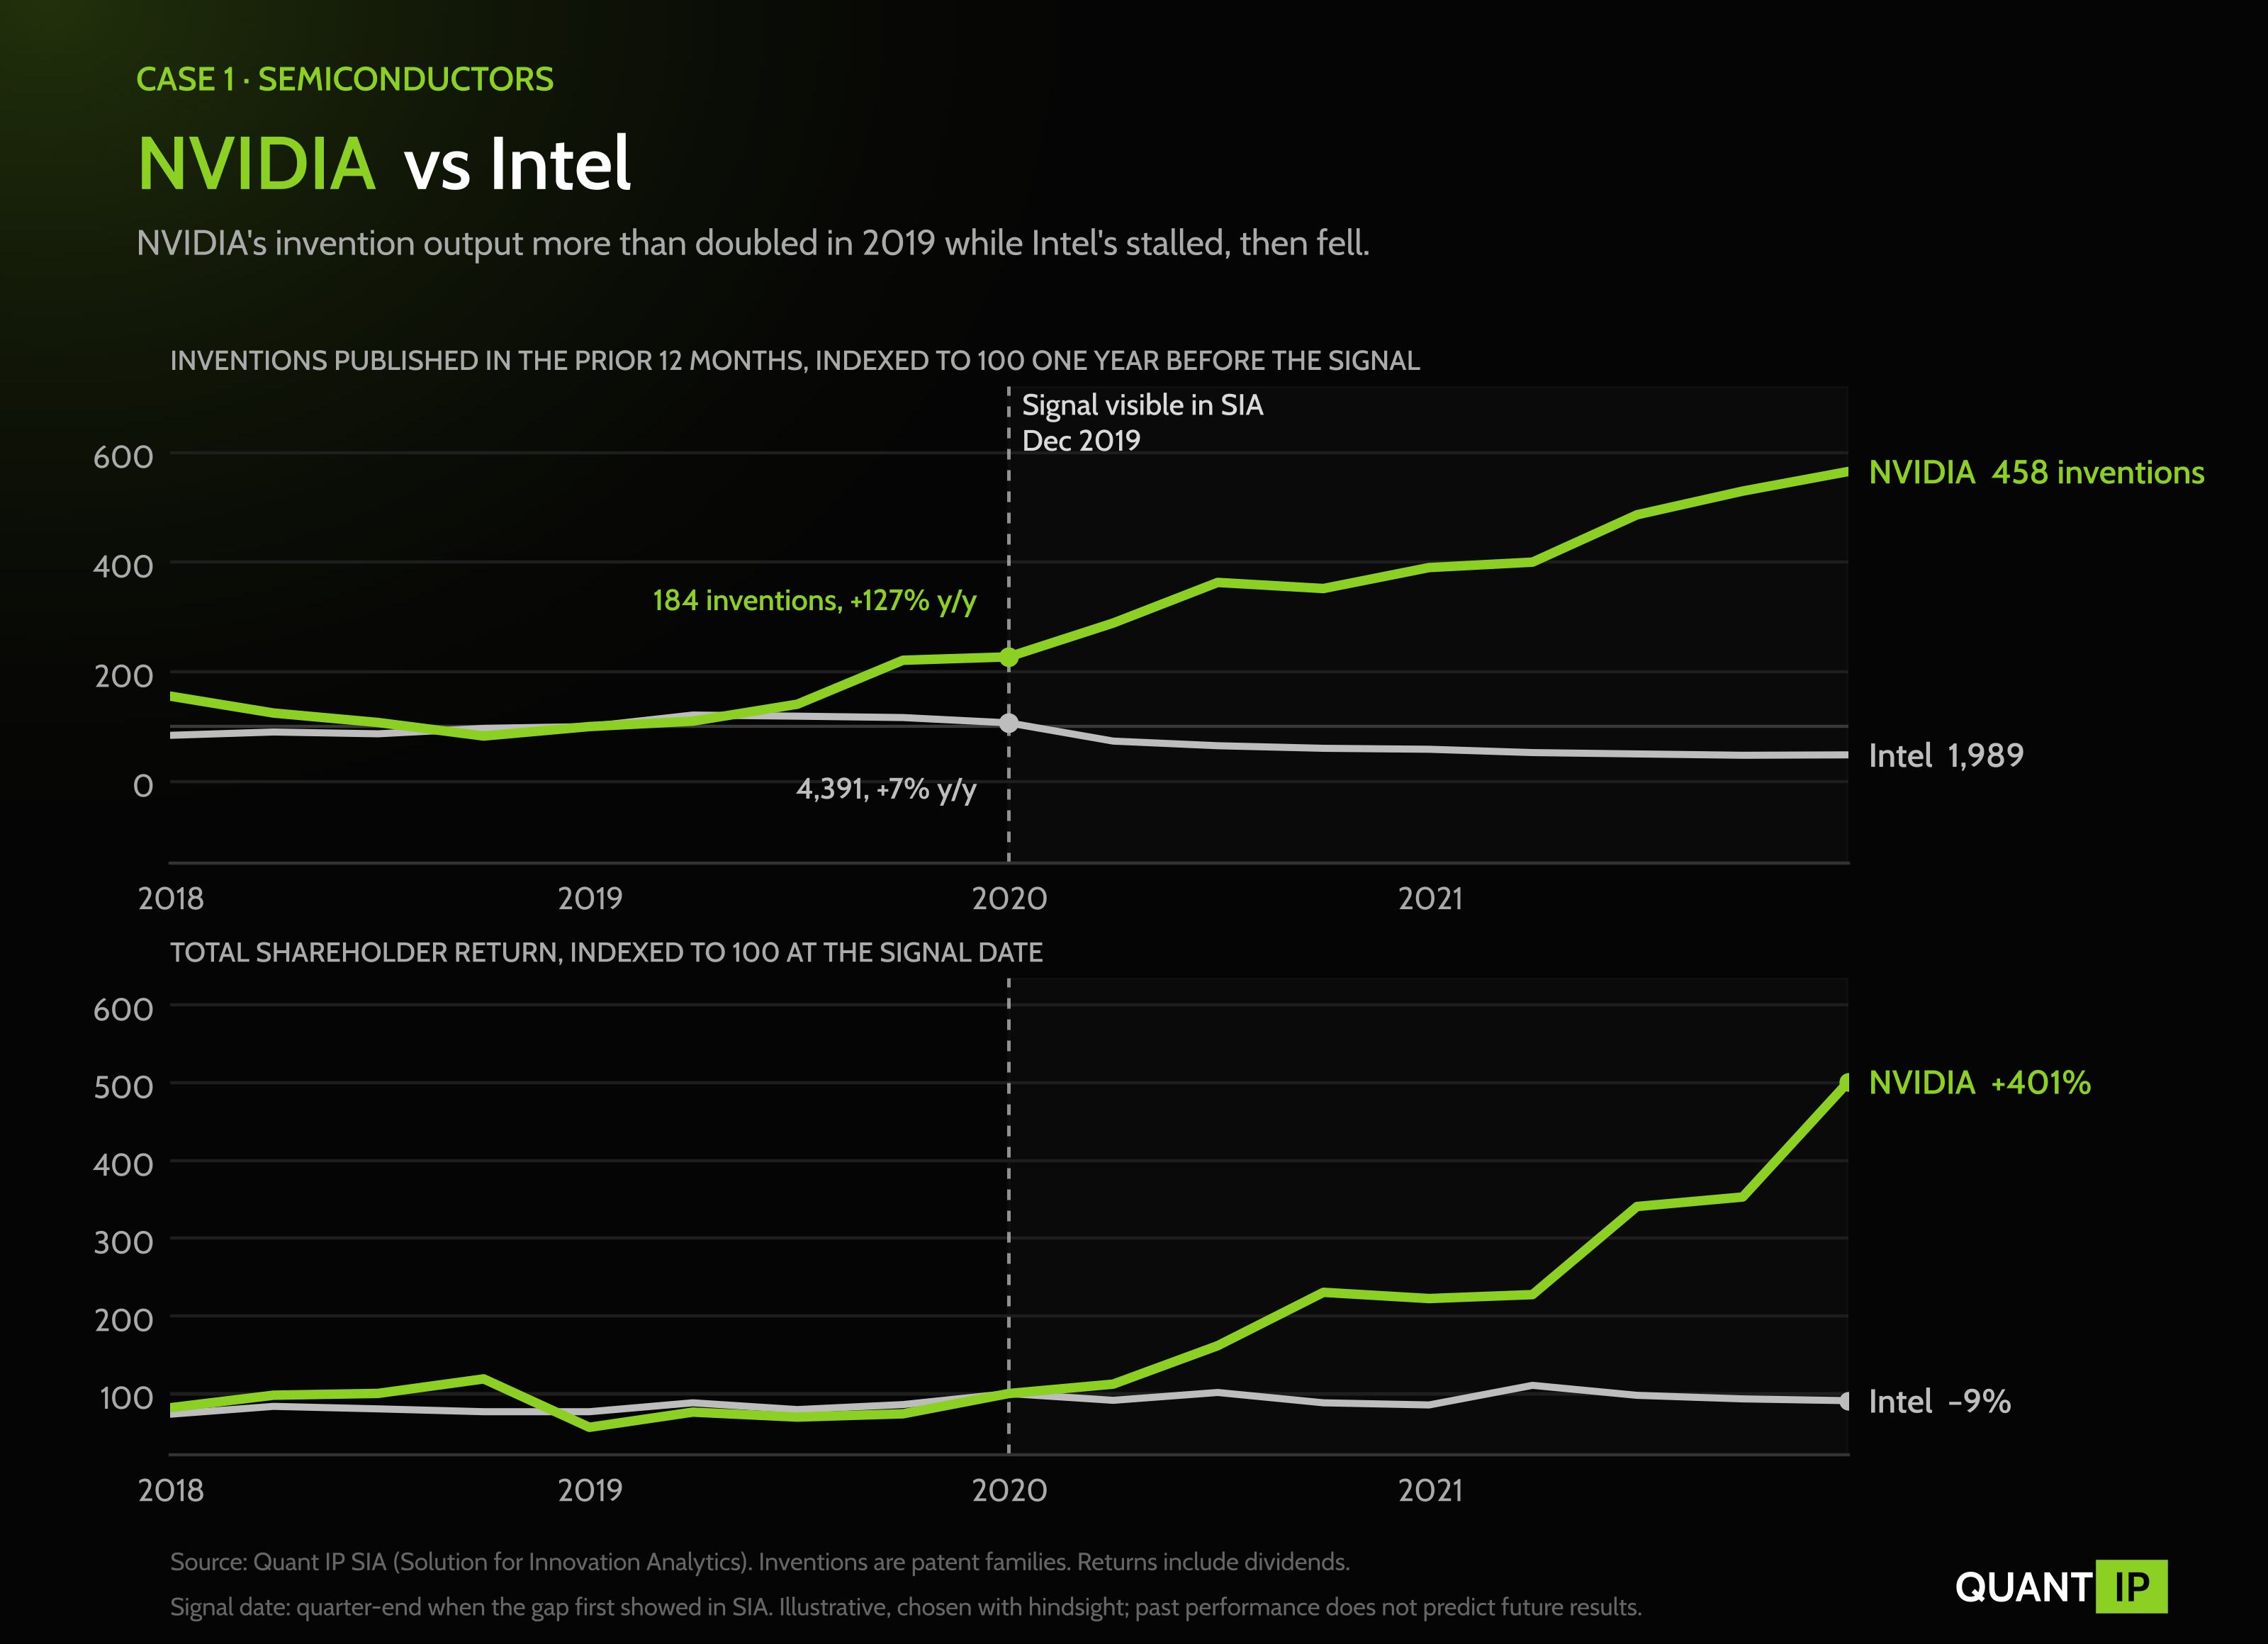
What the patent data showed. In the twelve months to December 2019, NVIDIA published 184 inventions, 127% more than a year earlier, and its high-quality inventions rose from 10 to 34, which lifted it from 46th to 7th in its peer group. Intel's output grew 7% over the same period, then fell 39% in the year to March 2020 and kept falling, to 1,989 inventions a year by the end of 2021, while NVIDIA's reached 458.
How they performed. From the end of 2019 to the end of 2021, NVIDIA returned 401% including dividends and Intel lost 9%. NVIDIA's data center revenue overtook gaming for the first time in mid-2020, and Intel announced further delays to its next manufacturing process.
The full cycle. An investor who used SIA at the start of 2020 to compare the two companies would have seen NVIDIA's output and quality accelerating while Intel's output stalled despite its far larger portfolio. $10,000 in NVIDIA on that date was worth about $50,100 two years later, against about $9,100 for the same amount in Intel, a gap of 410 percentage points. The signal also held: NVIDIA's twelve-month invention count was higher at the end of every year from 2019 to 2024, so an investor monitoring the pair in SIA had no patent-based reason to revisit the view.
Case 2: Arista vs Cisco in networking equipment
Arista and Cisco both sell the switches that connect servers inside data centers, and in 2020 the smaller company's patent record was growing far faster than the incumbent's.
The company. Arista sold high-speed switches to the largest cloud providers, a market in which it had been taking share, although its revenue fell slightly in 2020 as some of those customers paused spending.
The competitor. Cisco, the largest networking equipment company, published more than thirteen times as many inventions as Arista, ranked 3rd in their shared peer group of about 3,600 communications equipment companies and had far more high-quality inventions.
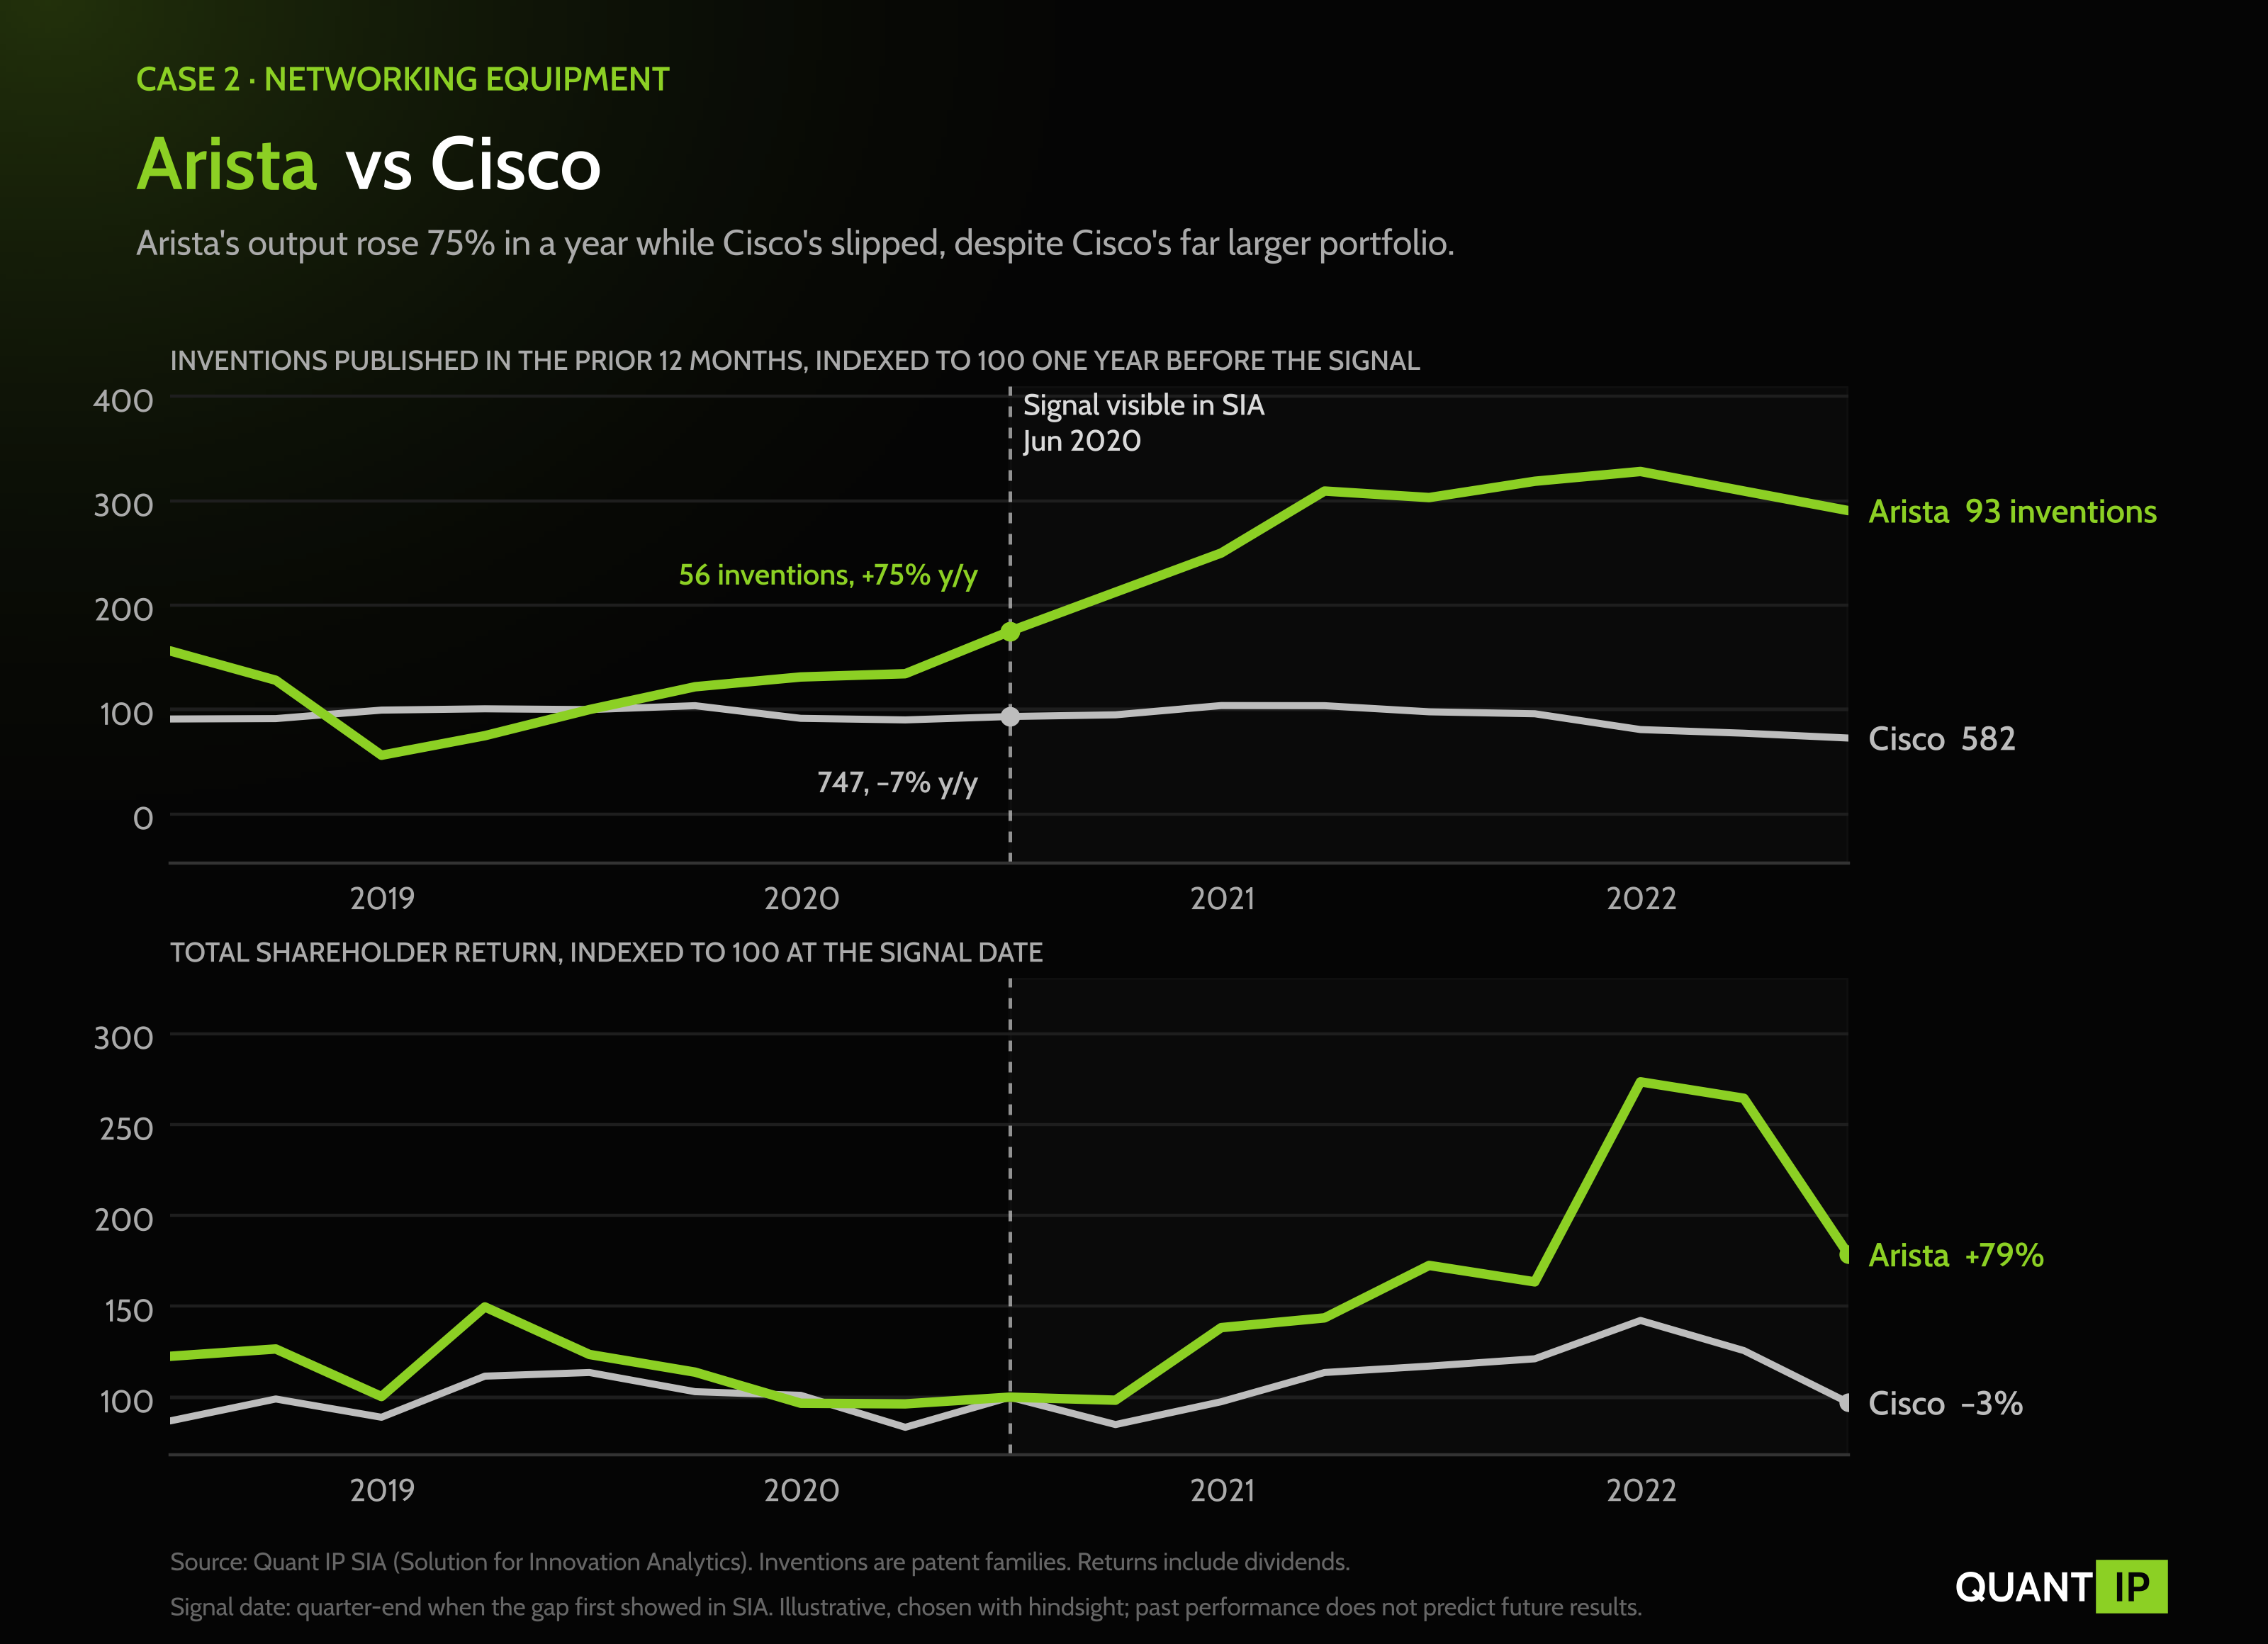
What the patent data showed. Arista's output rose for three consecutive quarters, and by the end of June 2020 it had published 56 inventions in twelve months, 75% more than a year earlier, which lifted its peer-group rank from 95th to 25th. Cisco's output slipped 7% over the same twelve months. Arista's count kept rising to 105 by the end of 2021, while Cisco's fell to 647. Cisco's inventions still scored higher on quality, so the signal here was momentum rather than quality.
How they performed. Over the next two years Arista returned 79% and Cisco lost 3%, as Arista's revenue grew 27% in 2021 and 49% in 2022 with the recovery in cloud spending.
The full cycle. $10,000 in Arista at the end of June 2020 was worth about $17,900 two years later, against about $9,700 in Cisco, a gap of 82 percentage points. The path was uneven: Arista's output stopped growing in 2022 and its shares fell with the wider technology market that year. A watchlist in SIA flags that kind of change, and Arista's output growth turned positive again in the second half of 2023.
Case 3: RTX vs Boeing in aerospace and defense
RTX and Boeing are two of the largest aerospace companies in the world, and by the end of 2023 SIA showed one of them expanding its invention output while the other was cutting it sharply.
The company. RTX, formed from the 2020 merger of Raytheon and United Technologies, makes Pratt & Whitney engines, Collins avionics and Raytheon missiles, and it spent the second half of 2023 dealing with a costly program to pull hundreds of its geared turbofan engines for inspection.
The competitor. Boeing had ranked among the strongest innovators in the sector for years. Its inventions scored higher on average quality than RTX's, and it entered 2024 still in the top three of its peer group of about 1,600 aerospace and defense companies.
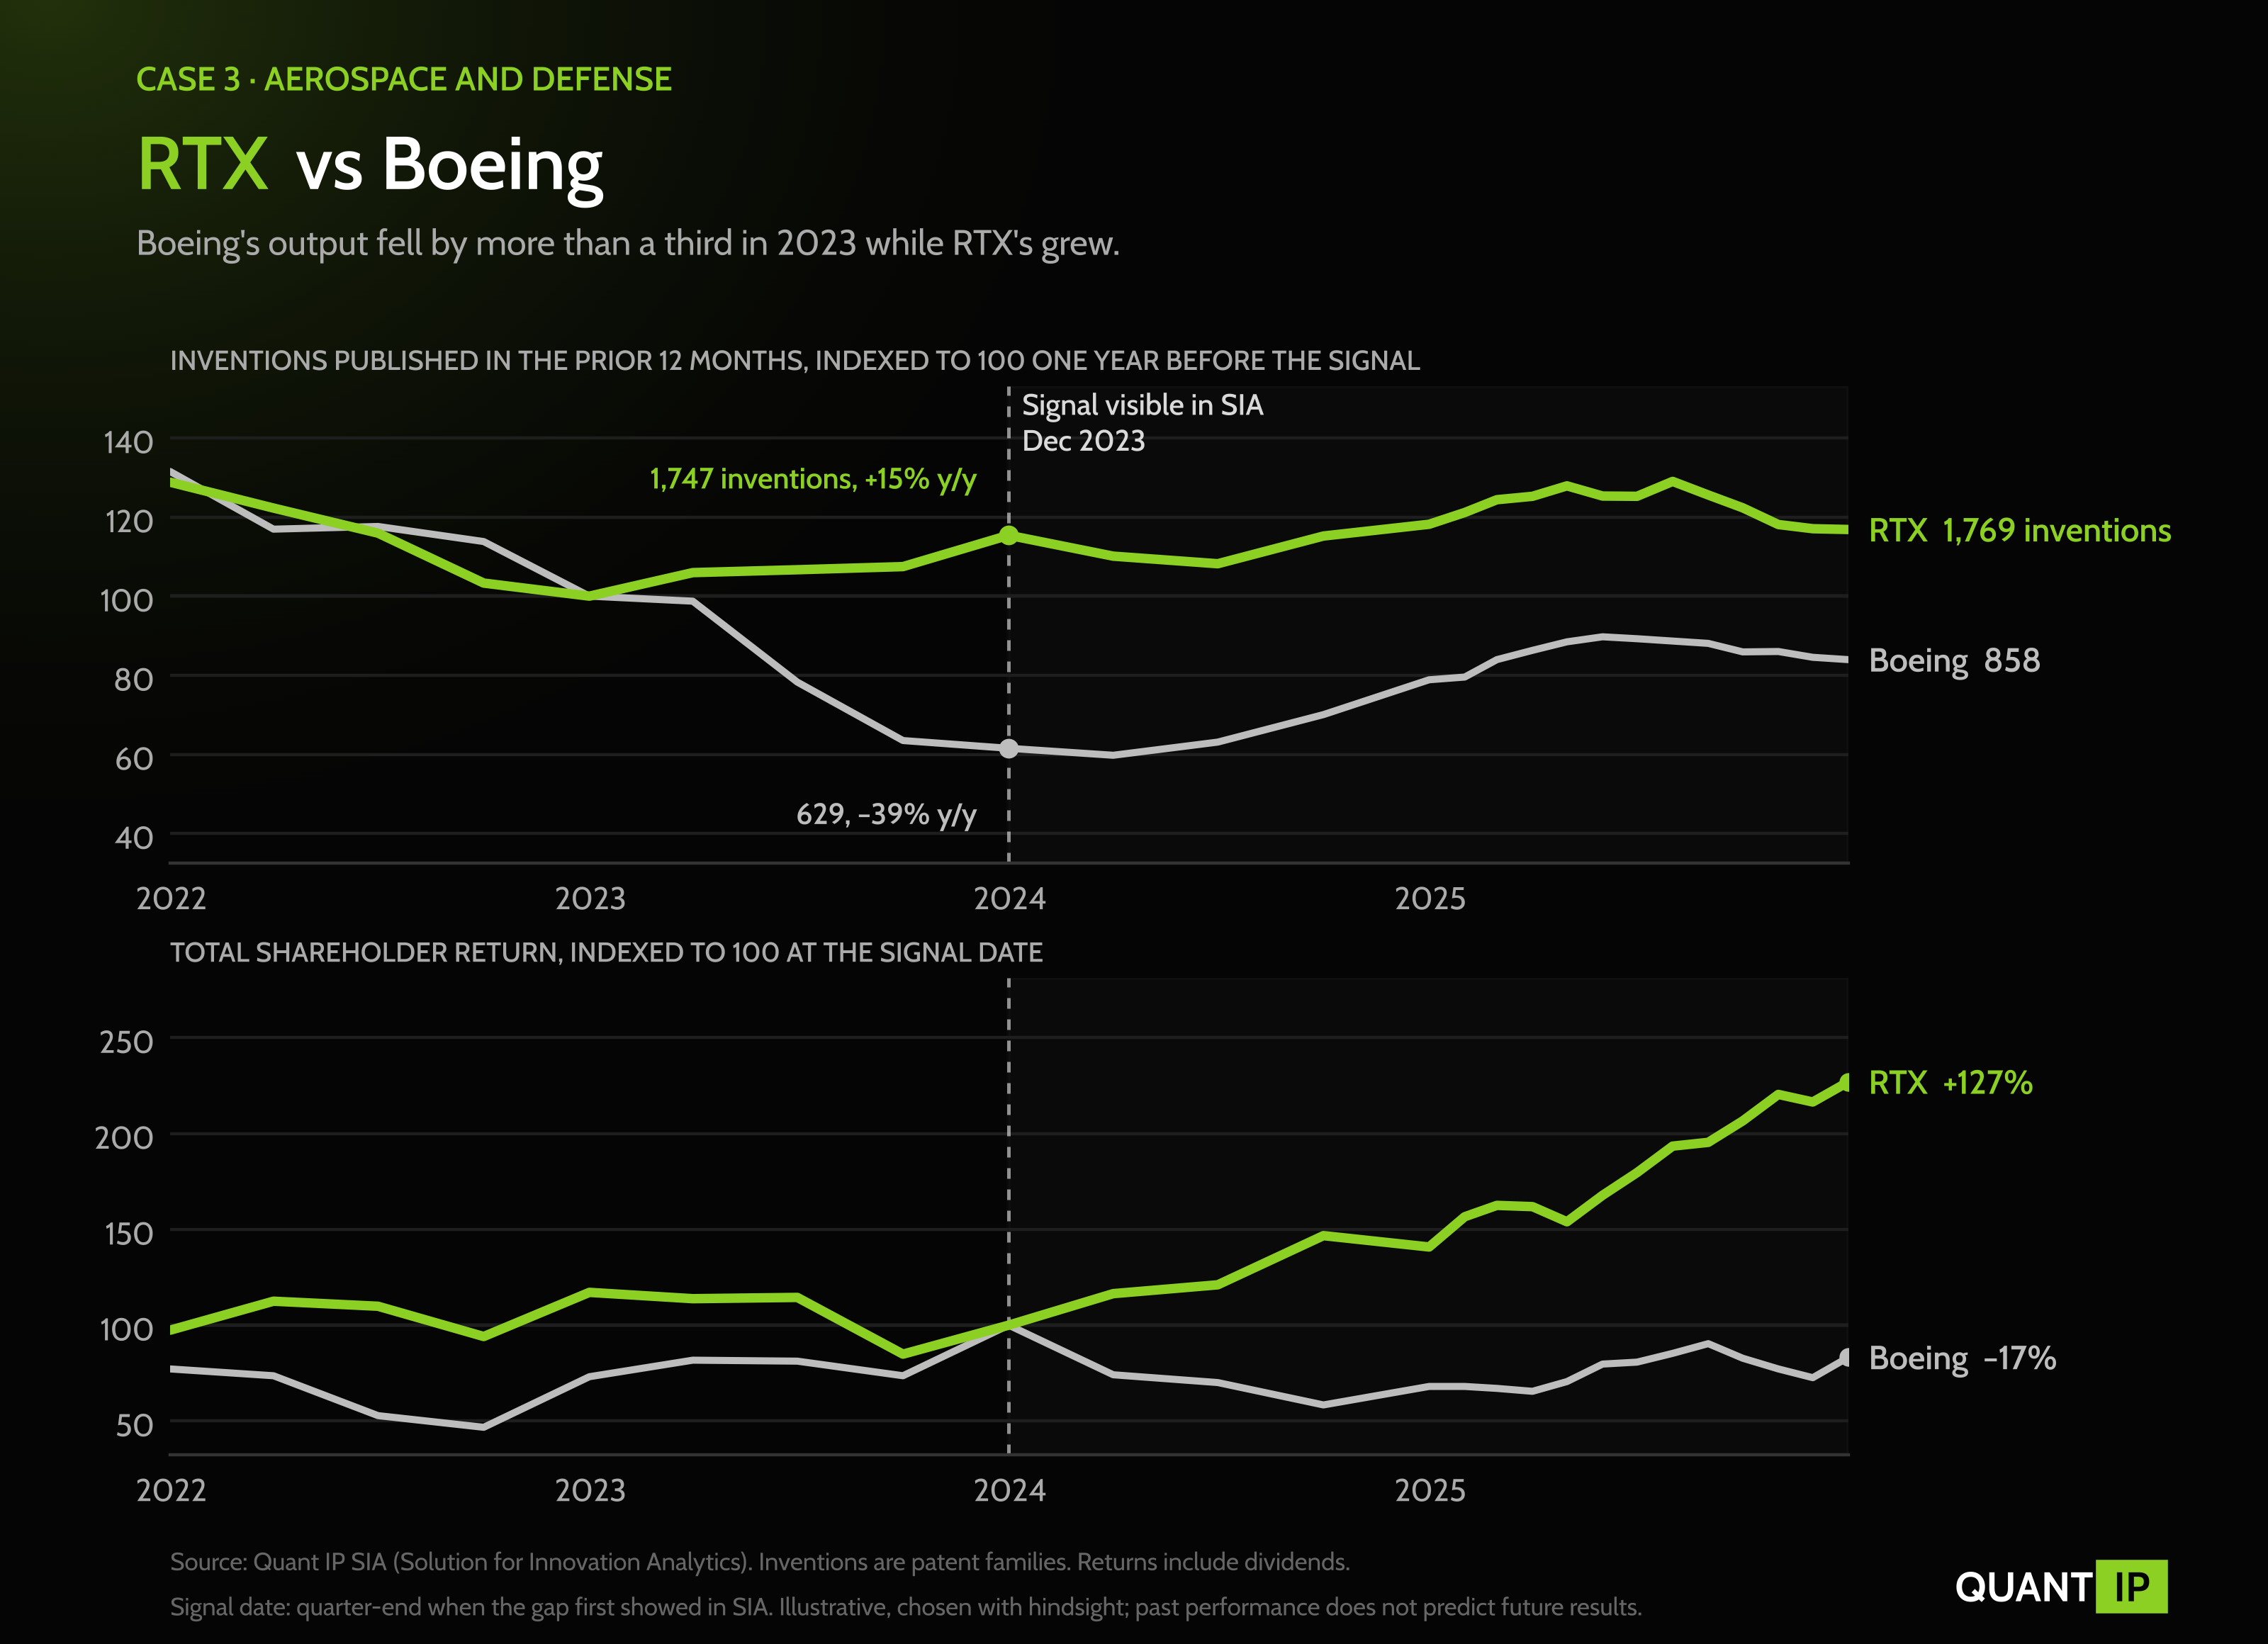
What the patent data showed. Boeing published 629 inventions in 2023, 39% fewer than in 2022 and 57% fewer than its ten-year peak of 1,455 in the twelve months to March 2021, even as its overall score stayed high. RTX published 1,747, 15% more than a year earlier and 2.8 times as many as Boeing, including 568 high-quality inventions to Boeing's 312.
How they performed. In 2024 a door plug blew out of a 737 MAX in January, regulators capped production and a seven-week strike halted most commercial aircraft output. Boeing lost 32% that year, the worst performance in the Dow, while RTX returned 41%. Over two years, through the end of 2025, RTX returned 127% and Boeing lost 17%.
The full cycle. $10,000 in RTX at the end of 2023 was worth about $22,700 two years later, against about $8,300 in Boeing, a gap of 144 percentage points. Monitoring mattered in this pair: Boeing's invention output turned up again in the second half of 2024 and was 44% higher in the twelve months to March 2025, and Boeing's shares rose 23% in 2025, although RTX's rose further.
Case 4: Eli Lilly vs Novo Nordisk in pharmaceuticals
By 2024, Eli Lilly and Novo Nordisk were the two companies most investors associated with obesity drugs, and their overall innovation scores were close while their patent output was moving apart.
The company. Eli Lilly sells tirzepatide as Mounjaro for diabetes and Zepbound for obesity, and by late 2024 it was competing with Novo Nordisk for leadership of the obesity-drug market.
The competitor. Novo Nordisk, the maker of Ozempic and Wegovy, had built that market and had been Europe's most valuable listed company. On SIA's overall score, Lilly ranked 15th and Novo 25th among roughly 6,900 listed pharmaceutical companies.
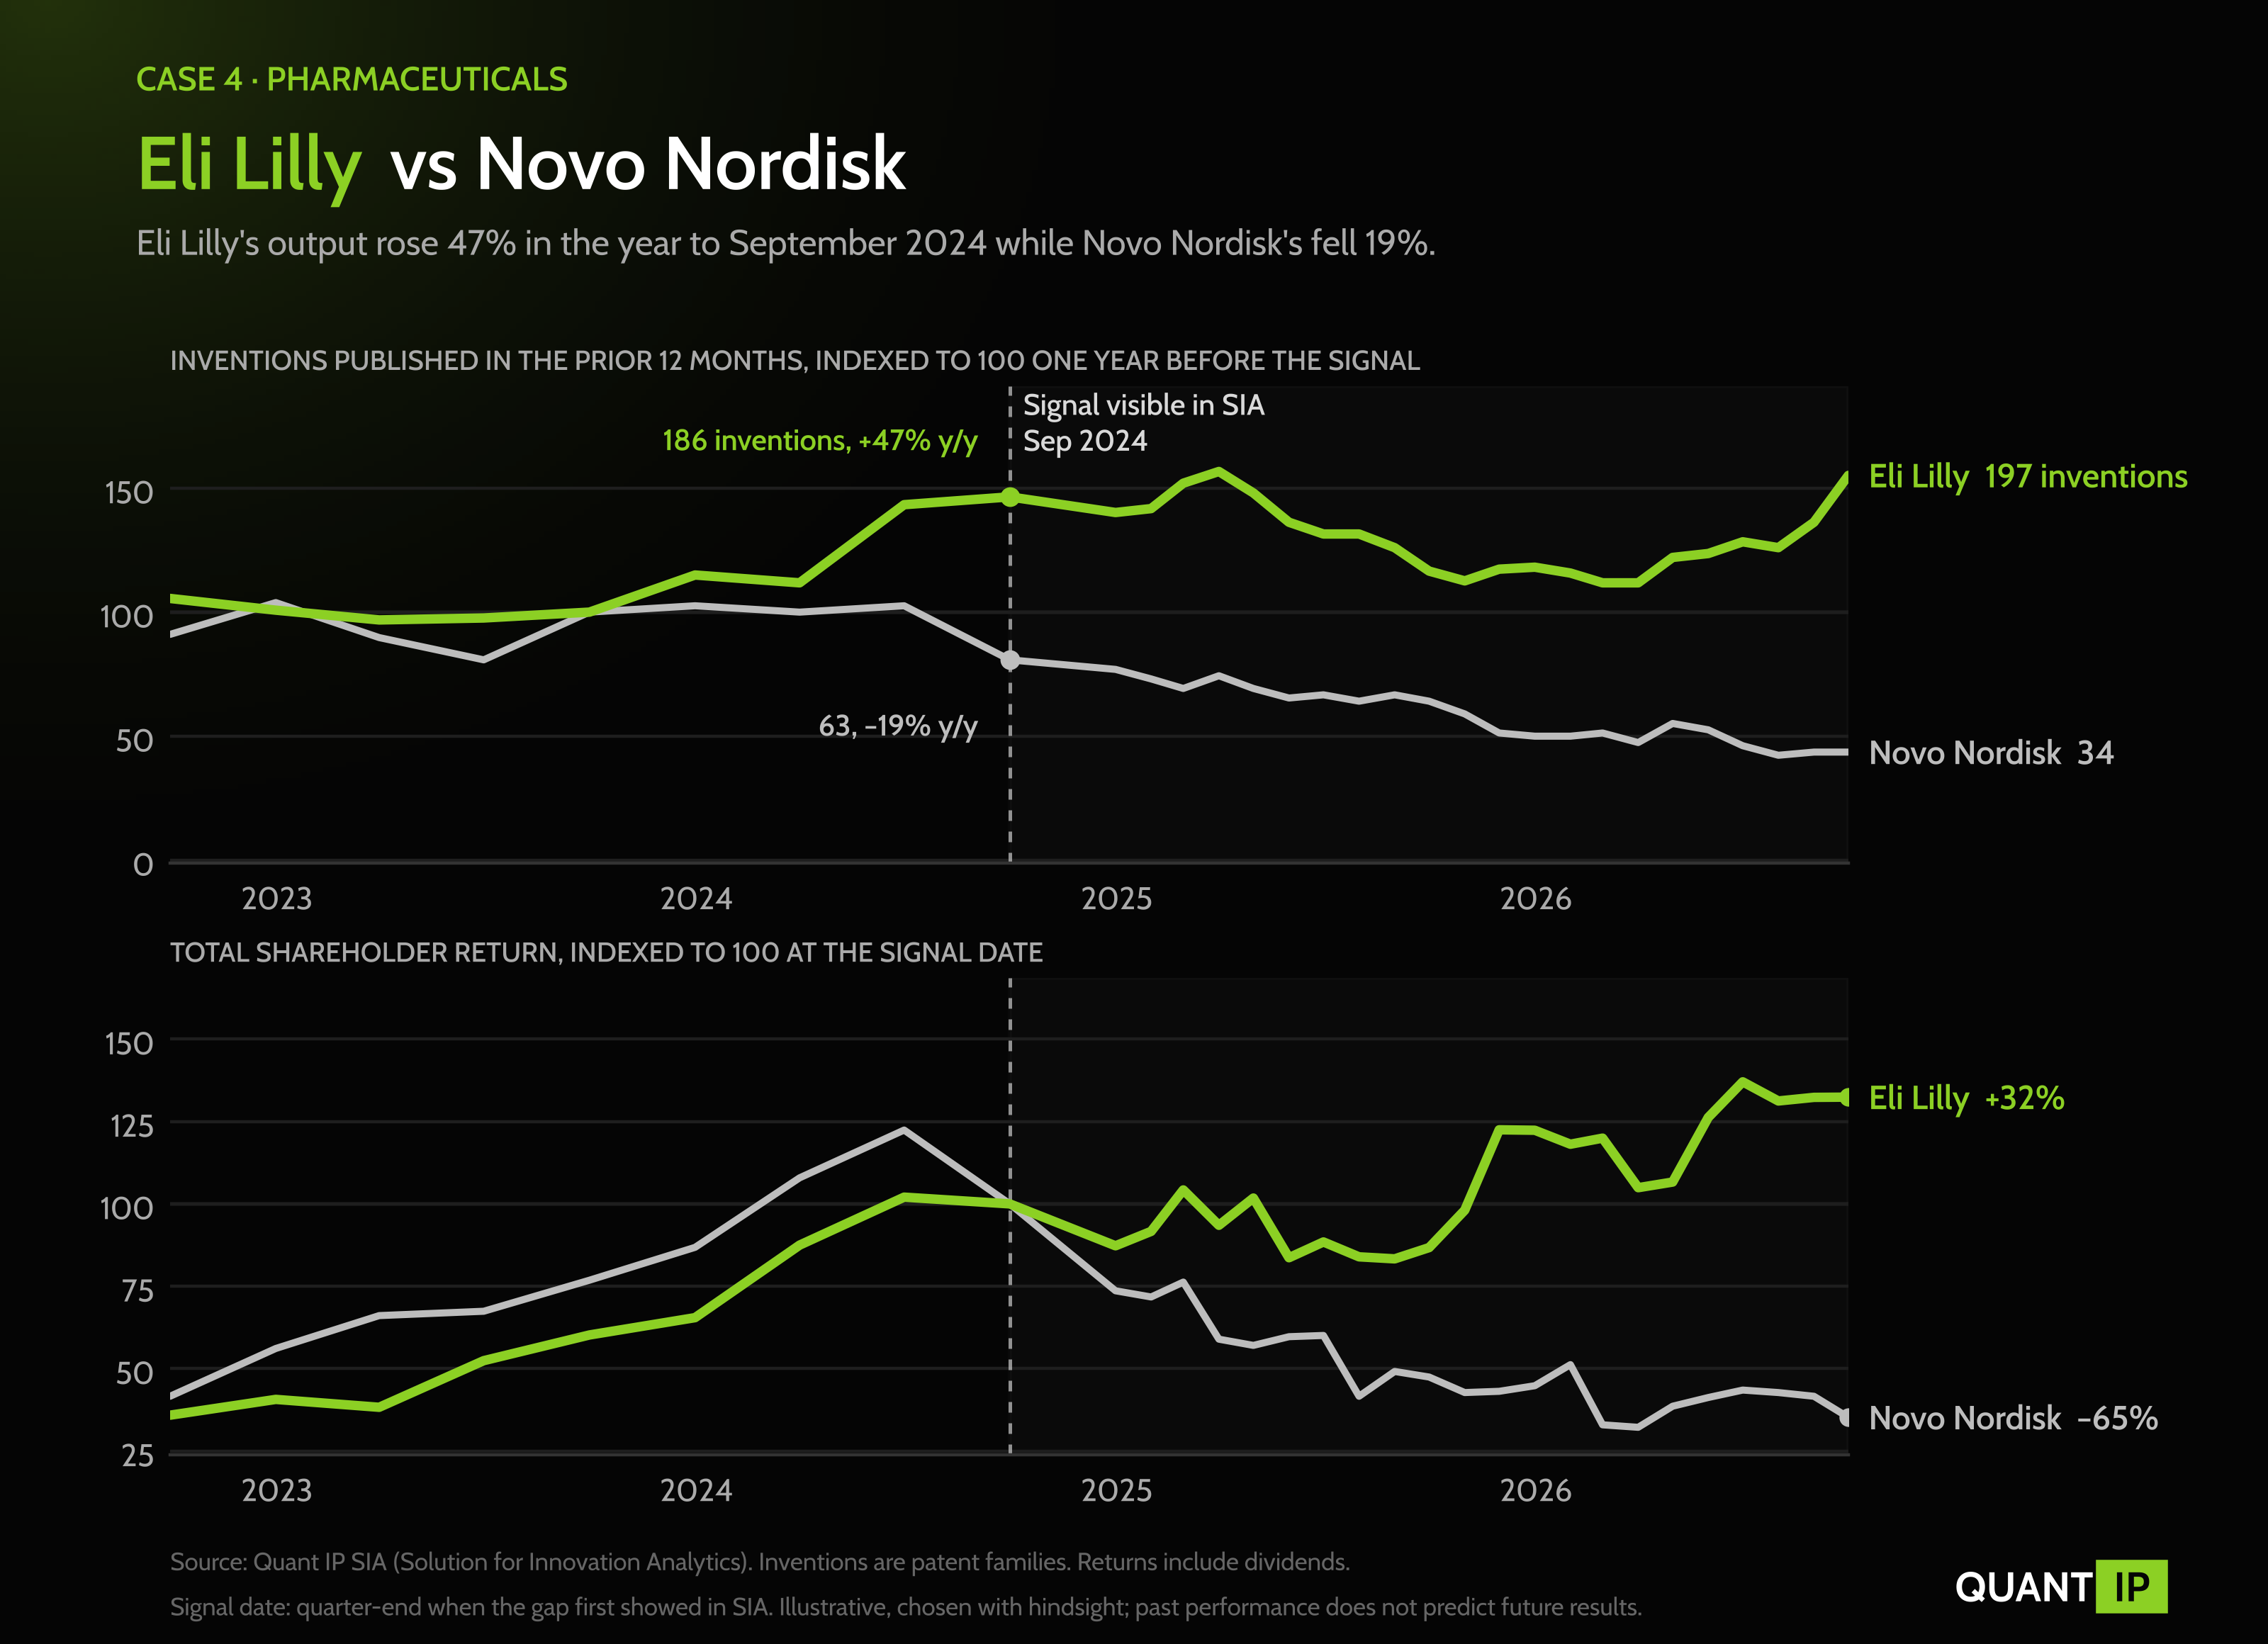
What the patent data showed. In the twelve months to September 2024, Lilly published 186 inventions, 47% more than a year earlier, while Novo published 63, 19% fewer, and Lilly's 48 high-quality inventions compared with Novo's 14. Novo's count kept falling, to 50 a year later and 34 by September 2026, while Lilly's dipped in 2025 and recovered to 197.
How they performed. Over the next two years Novo guided to lower sales and profit for 2026 and saw its next-generation obesity drug CagriSema fall short of Lilly's tirzepatide in a head-to-head trial, and by February 2026 it had lost roughly $475 billion of market value after being worth more than $650 billion in 2024. Lilly became the first drugmaker valued at $1 trillion in November 2025. Lilly lost 13% over the first twelve months and returned 32% over twenty-four, while Novo lost 53% and 65% over the same periods.
The full cycle. This case shows why patent data works best as a relative measure. An investor who held only Lilly would have been down 13% after a year, even though Lilly was 39 points ahead of Novo. $10,000 in Lilly at the end of September 2024 was worth about $13,200 two years later, against about $3,500 in Novo, a gap of 97 percentage points. Lilly's own output dipped in 2025 and recovered in 2026, when its peer-group rank rose to 3rd and its shares reached new highs.
What the four cases have in common
In two of the four pairs the eventual leader was the smaller patent owner, since Intel and Cisco had far larger portfolios and higher innovation scores at the signal date. In the other two the leader already published more inventions, but the headline scores understated the gap, because Boeing still ranked in its sector's top three and Lilly and Novo sat only ten places apart in a peer group of almost 7,000. What separated the two companies in each pair was the direction of invention output relative to a direct competitor, and in three of the four the leader's count of high-quality inventions also grew faster than its rival's.
In each pair, the company whose invention output was rising against a direct competitor delivered the higher return over the next two years.
The gap did not always last. Boeing's output recovered within a year, and Arista's stalled in 2022, which is why these cases pair a signal with ongoing monitoring rather than a one-off verdict. They were also chosen with hindsight to show how the data is used, and every outcome had other causes, from a door plug to a clinical trial. The systematic case for patent data rests on tests that rank whole universes without picking winners, such as Quant IP's backtest and revenue study, and individual cases show how an analyst puts that evidence to work on a single pair.
FAQ
Can patent data show which of two competitors will outperform?
Patent data shows which of two rivals is expanding its inventive output, a leading indicator rather than a forecast for any single stock. In the four cases here the company with the stronger patent momentum delivered the higher two-year return, and in Quant IP's sector-neutral US backtest companies with the most high-quality inventions outperformed those with none by 4.9% a year and in 16 of 25 years.
How was the signal date chosen?
The signal date is the quarter-end at which the gap between the two companies first showed clearly in SIA's twelve-month invention counts and then persisted. Returns are measured from that date, using only patent data that had been published by then.
Why compare competitors in the same industry?
Patenting rates differ widely between industries, so a raw count says more about a company's sector than about its innovation. Comparing two companies in the same SIA peer group puts them on the same basis, and the change in each company's output matters more than the size of its portfolio.
Do the returns include dividends?
Yes. All returns are total shareholder returns, including dividends, before trading costs and taxes, and the dollar figures are hypothetical.
About us
Quant IP is an alternative data provider delivering patent data and innovation analytics built for financial markets. Its Solution for Innovation Analytics (SIA) helps fundamental and thematic investors compare companies, investigate technology exposure and assess competitive position. Systematic teams can evaluate company-level or invention-level patent data feeds for their own research.
Disclaimer
This content is for informational purposes only and does not constitute investment advice, financial analysis, or a solicitation to buy or sell any financial instrument. The information provided makes no claim to completeness or accuracy. Hypothetical returns are based on historical data for cases selected with hindsight and do not reflect actual trading, costs or taxes. Past performance is not indicative of future results.
Schedule a demo